Dashboard testing
Inspect workflow definitions and run workflows in the embedded dashboard.
Registered workflows appear in the embedded Runiq Dashboard.
The dashboard can show workflow metadata, steps, transitions, run status, step inputs, step outputs, and tool calls produced inside agent steps. Use the travel planner sample as an inspection aid: the domain is intentionally simple, so the important part is the pattern of controlled multi-step execution.
Dashboard examples
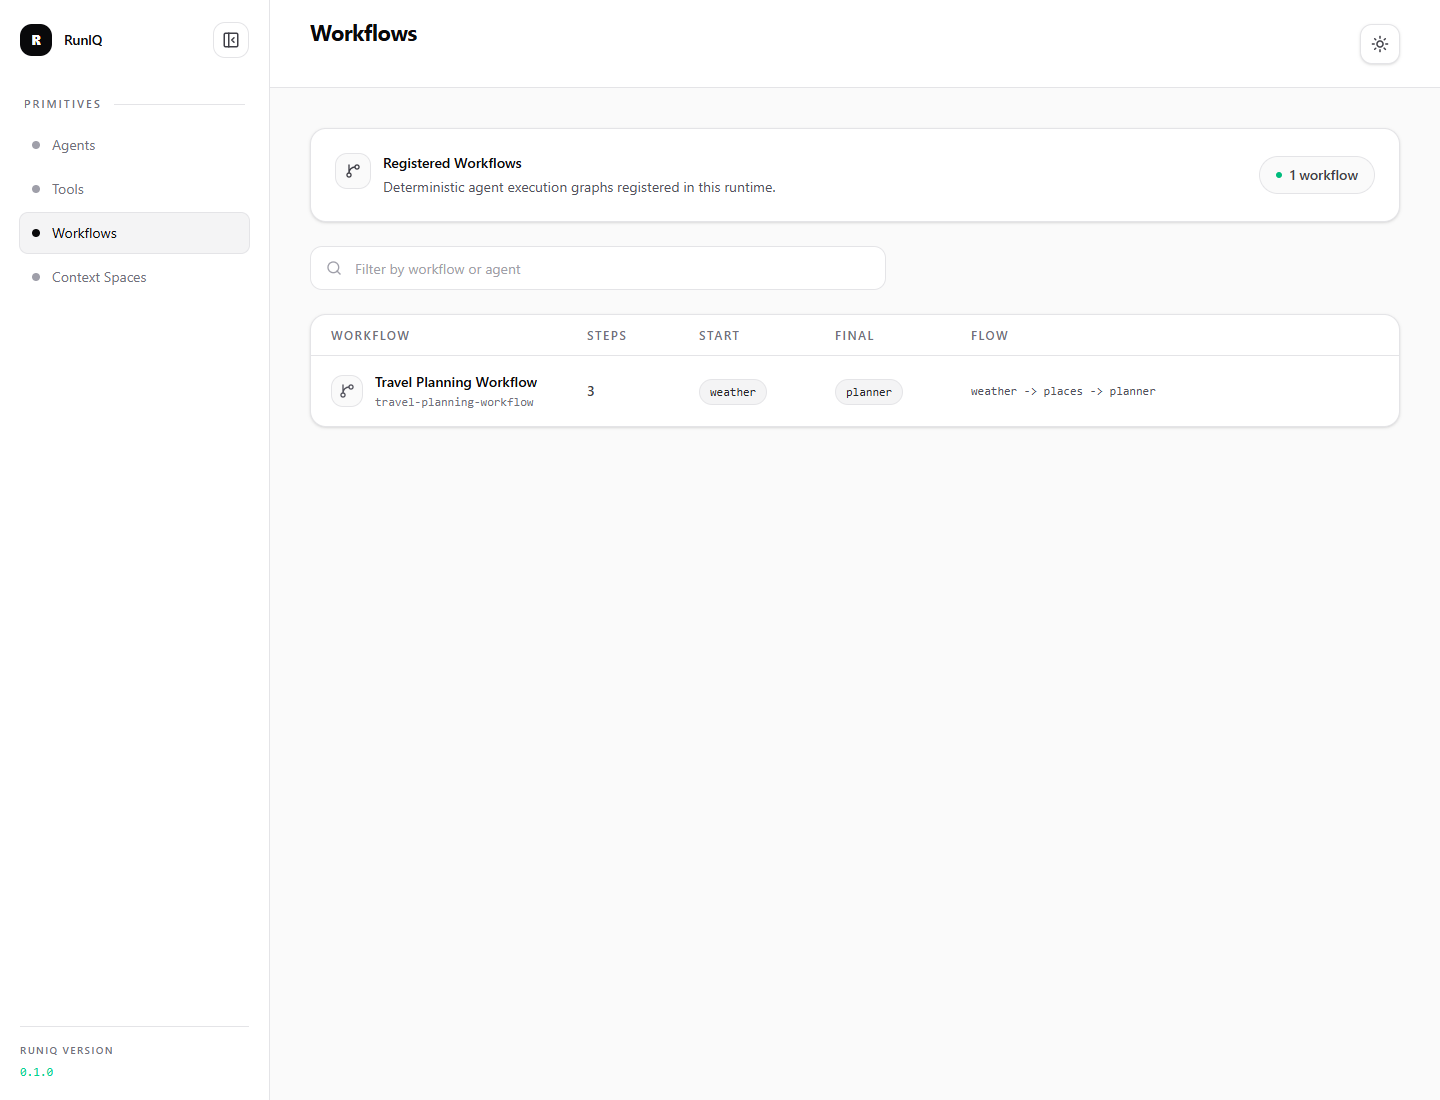
The workflows list shows what the running .NET application registered at startup. It is a quick way to confirm that the process is discoverable, has the expected start and final steps, and exposes the intended execution order before anyone builds a custom UI.
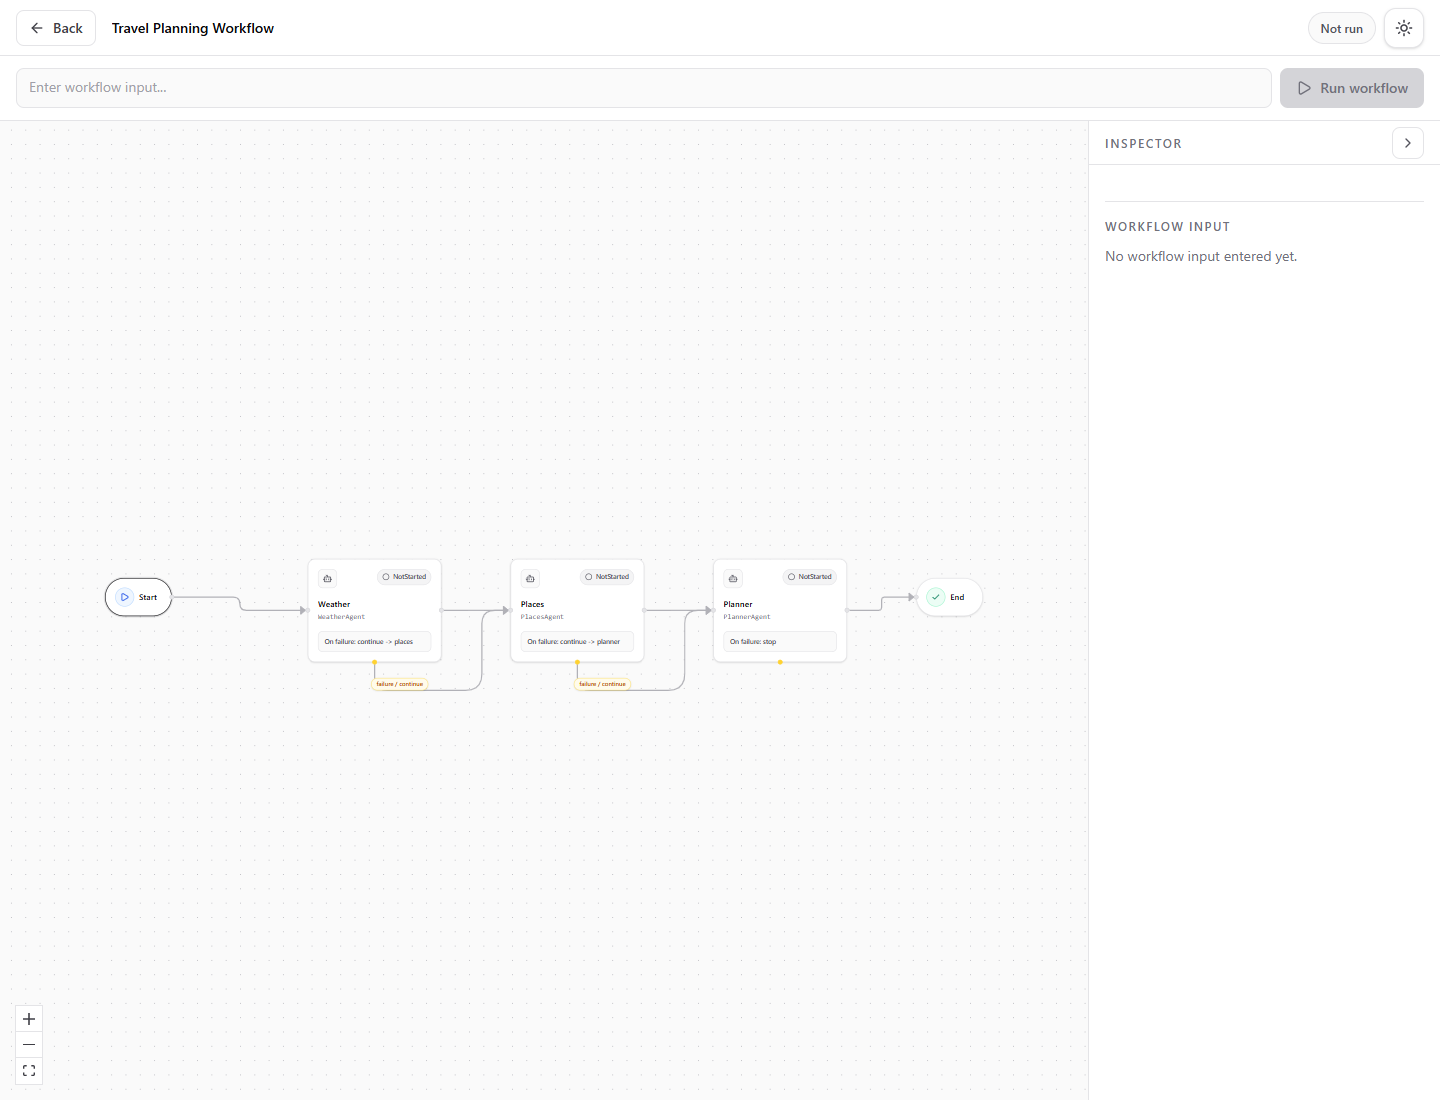
The workflow graph shows the deterministic route before a run starts. In this sample, weather -> places -> planner is only a readable example; the same shape can represent expense lookup -> policy analysis -> approval recommendation or support triage -> policy check -> final response.
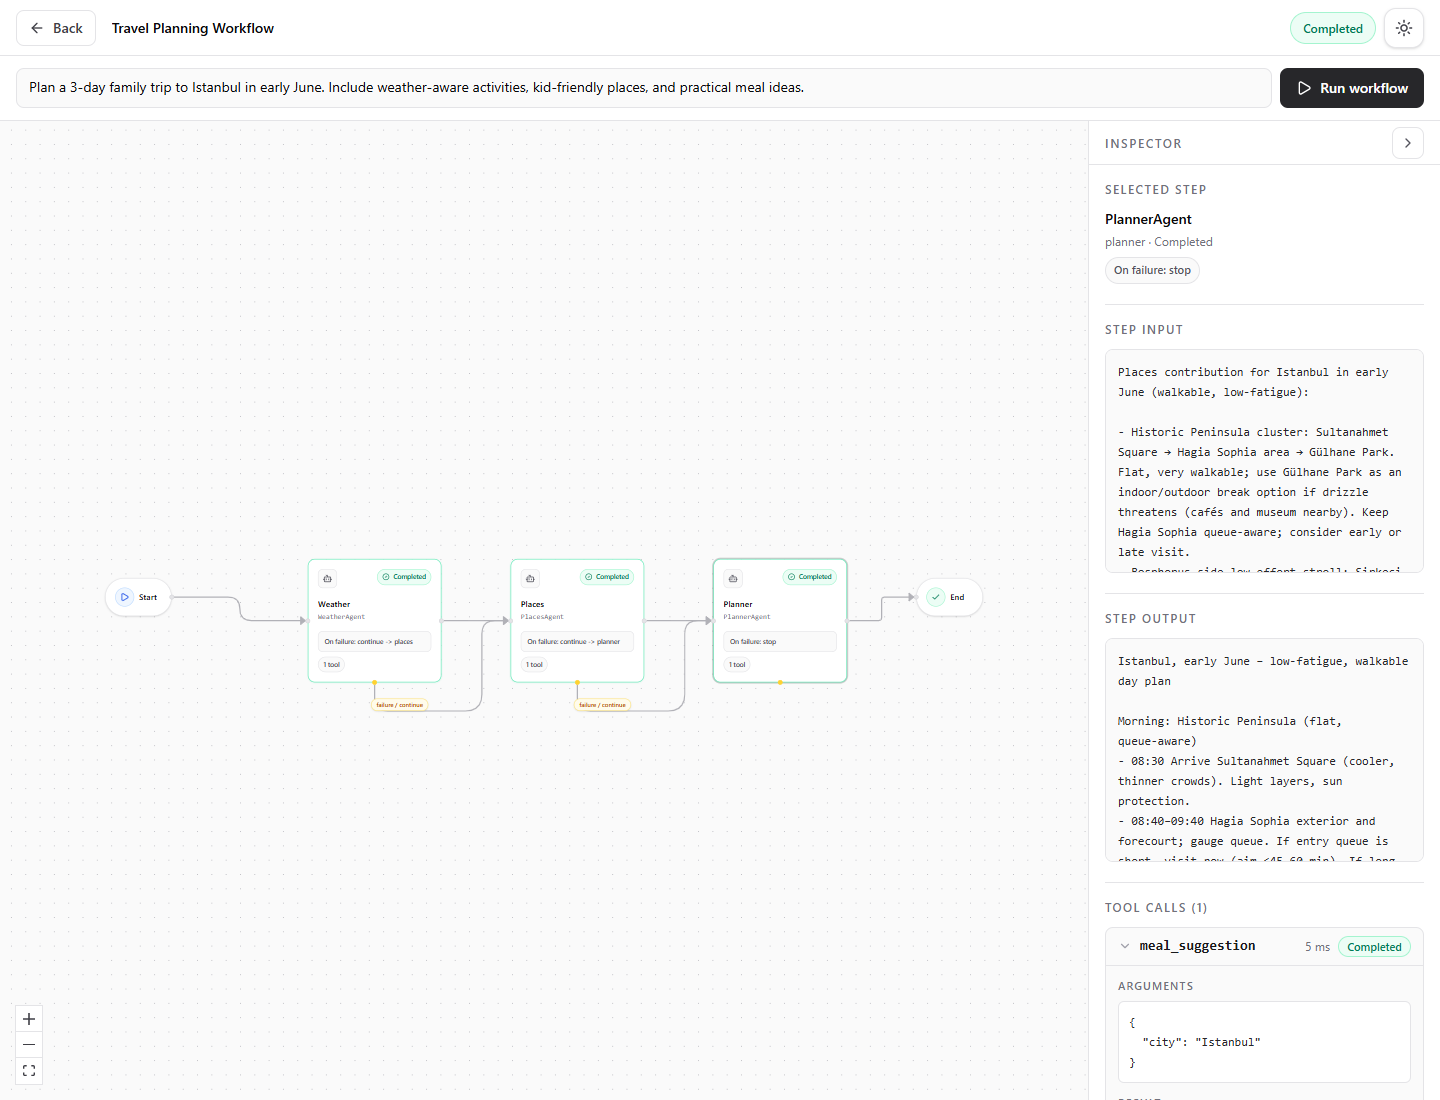
After execution, each step shows status, intermediate input, output, and captured tool calls. This is the main debugging value: teams can see whether the issue came from orchestration, an agent instruction, a tool response, or the final synthesis step.
Test input
For the travel workflow sample, run:
Expected behavior:
| Area | What to inspect |
|---|---|
| Workflow metadata | travel-planning-workflow with weather, places, and planner steps. |
| Weather step | Produces weather and comfort context, possibly with weather tool calls. |
| Places step | Produces place suggestions and route considerations. |
| Planner step | Produces the final user-facing itinerary. |
| Final output | The final answer should come from the last completed step. |
The exact trip content is not the point of the sample. What matters is that a developer can see the same product-owned sequence run repeatedly, inspect each stage, and decide which parts should stop, continue, or route to fallback when something fails.
Useful endpoints
With dashboard path /dashboard:
The run endpoint accepts:
These dashboard APIs are useful for testing workflow behavior without building your own UI first.