Testing tools
Use Studio to inspect tool contracts and run tools directly.
Studio lets developers inspect and run typed Runiq tools.
This is valuable because tool bugs are often contract bugs: wrong input shape, unclear description, missing registration, unexpected output, or a tool not attached to the agent that needs it.
Tool call example
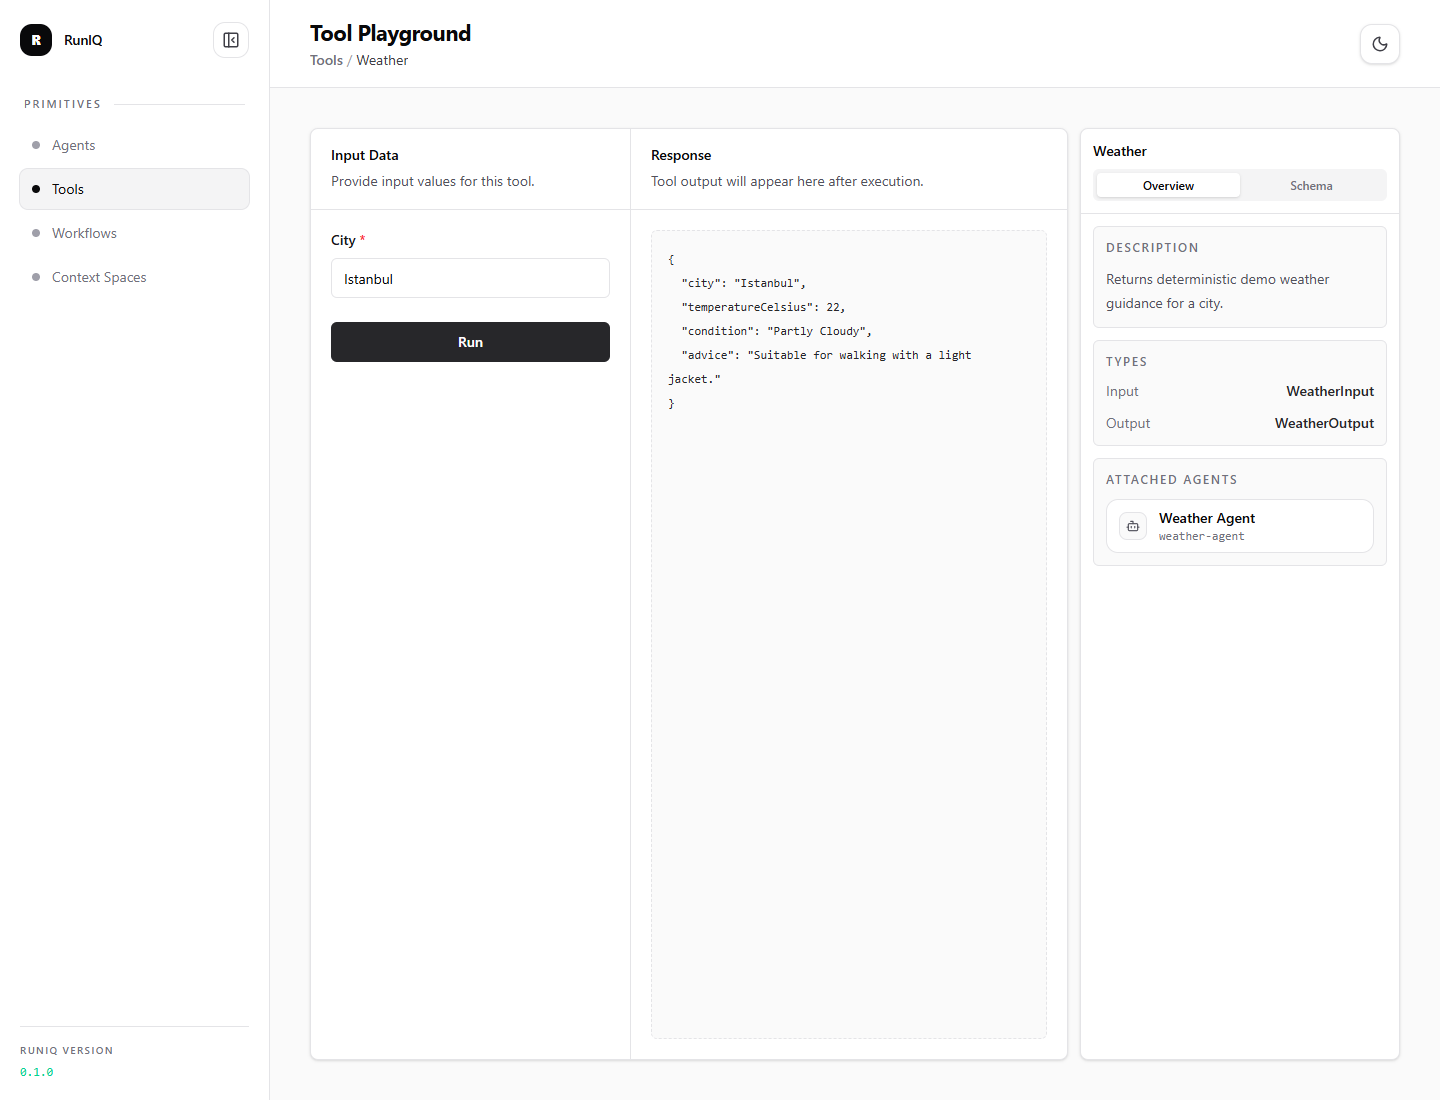
The tool playground runs the same typed .NET tool that an agent can call later. In the screenshot, the weather tool is intentionally simple; the important part is that the input contract, output shape, attached agent, and runtime response are visible before the tool is trusted inside an agent flow.
What to test
Use Studio to check:
- tool name and description,
- input schema generated from the input CLR type,
- output schema generated from the output CLR type,
- attached agents,
- direct tool run output,
- tool failures and error messages.
Direct tool run flow
This keeps debugging clean. First prove the tool works as a native .NET capability. Then test whether the agent chooses it correctly.
This is especially useful for existing applications. A tool can wrap an application service, repository, policy engine, pricing calculator, or internal API. Studio lets developers validate that bridge directly, with concrete input and output, before asking a model to use it.
Example request
With Path = "/studio":
Studio uses the same direct tool run API behind the UI.